
Mar 21, 2022
My ConvertKit Dashboard in Coda
Manage and analyze your ConvertKit subscribers. Keep track of your forms, sequences, tags and broadcast …


Mermaid Pack lets you create diagrams and visualizations using text. This blog post demonstrates what is possible with different examples.
Mermaid is a Javascript based diagramming and charting tool that renders Markdown-inspired text definitions to create and modify diagrams dynamically. It is a free and open source tool that is used by developers and designers to create and share diagrams.
With the Mermaid Pack we make it easier for you to use Mermaid in Coda, enabling you to create diagrams and visualizations using text and even formulas!
Coda is the all-in-one doc that brings words, data, and teams together. It starts with a blinking cursor on a blank page and can grow as big as your team’s ambition. Coda comes with a set of building blocksーlike pages for infinite depth, tables that talk to each other, and buttons that take action inside or outside your docーso anyone can make a doc as powerful as an app. People have made Coda docs that do everything from launch products, to scale small businesses, to help them study for tests.
Packs are Coda version of integrations or plug-ins. They connect your doc to the apps you use every day, so you can pull live data in or push updates out automatically.
The Pack includes formulas that allow you to create different types of diagramas that we will explore next. You can see the full reference here.
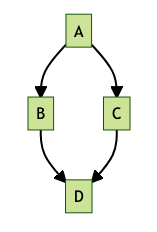
Flowcharts are composed of nodes, the geometric shapes and edges, the arrows or lines.
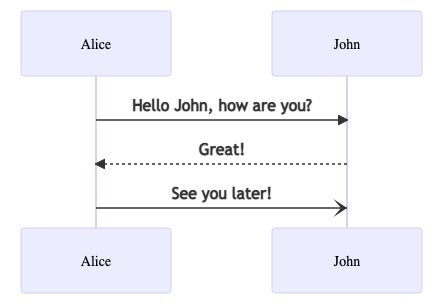
A sequence diagram is an interaction diagram that shows how processes operate with one another and in what order.
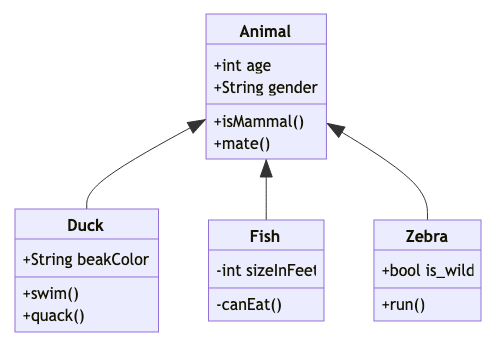
The class diagram is the main building block of object-oriented modeling.
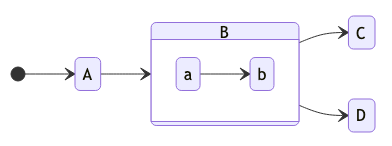
A state diagram is a type of diagram used in computer science and related fields to describe the behavior of systems.
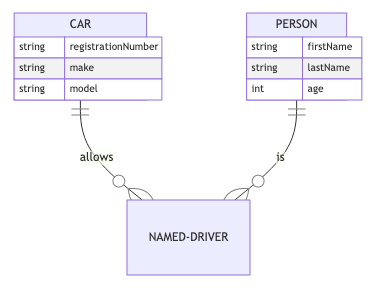
An entity-relationship model (or ER model) describes interrelated things of interest in a specific domain of knowledge.
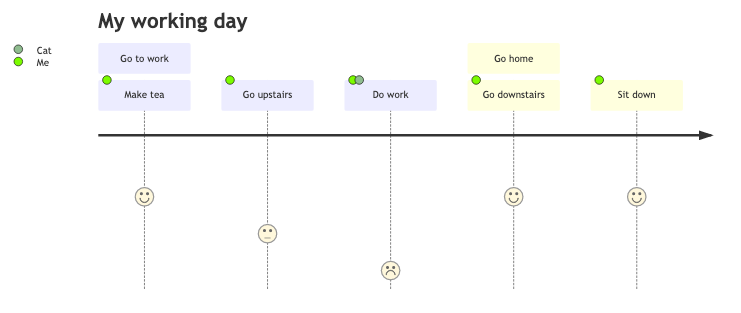
User journeys describe at a high level of detail exactly what steps different users take to complete a specific task within a system, application or website.
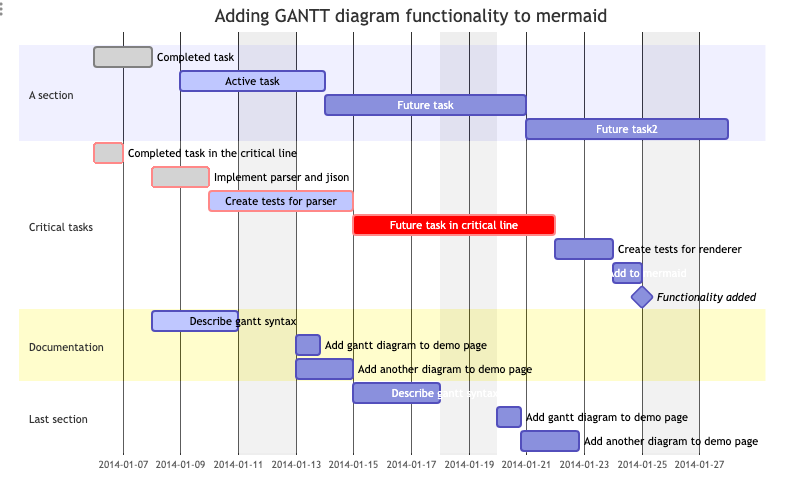
A Gantt chart is a type of bar chart that illustrates a project schedule and the amount of time it would take for any one project to finish.
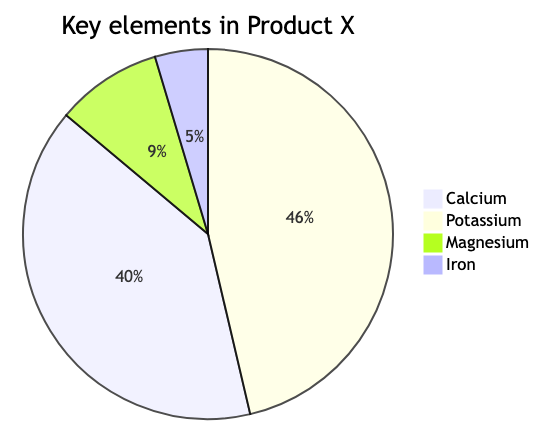
A pie chart is a circular statistical graphic, which is divided into slices to illustrate numerical proportion.
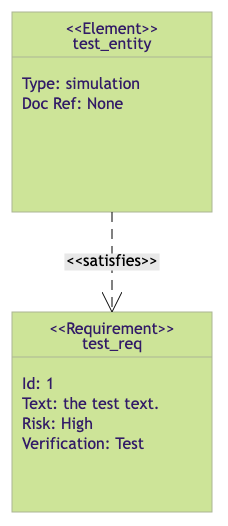
A requirement diagram provides a visualization for requirements and their connections, to each other and other documented elements.
View the example doc to start using the Mermaid Pack in Coda. We have created this example doc reproducing all Mermaid examples with how to integrate with formulas, available themes and more.
View the Doc
Software developer. Indie hacker. Give power to the people.
Manage and analyze your ConvertKit subscribers. Keep track of your forms, sequences, tags and broadcast …

Manage and analyze your Gumroad membership subscriptions and product sales. Examples on how to use formulas …

Integrate Notion databases with Coda to take advantage of Coda automations, charts, buttons and the Packs …